Recently Viewed ›
Recently Downloaded 
Close x

Use these tally chart templates to introduce your class to scientific experiments and data gathering. They can tally how many of their classmates have brown eyes, how many cups of coffee their teacher drinks - there are so many things they can track using the universal tally method. It's a useful skill and a great way to get them learning about the scientific method.
 tally charts
tally chart template
tally marks
tally
tally template
bar graph template
tally charts year 2
blank tally chart
collecting data
bar graph
blank tally chart template
graph template
data table
tally marks early level
survey template
3 - 4
years 3 - 4
pictogram
statistics activities and worksheets
tally charts
tally chart template
tally marks
tally
tally template
bar graph template
tally charts year 2
blank tally chart
collecting data
bar graph
blank tally chart template
graph template
data table
tally marks early level
survey template
3 - 4
years 3 - 4
pictogram
statistics activities and worksheets
Great resource, I am using it for Science to link with Maths x
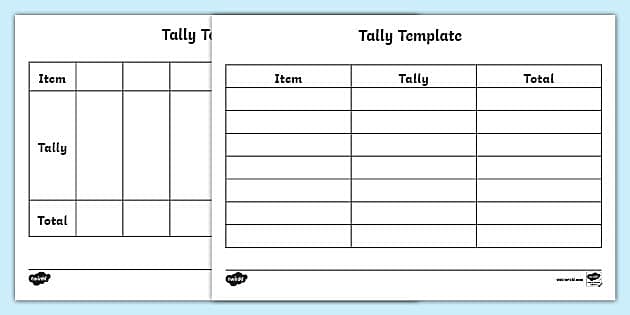
Use these tally chart templates to introduce your class to scientific experiments and data gathering. They can tally how many of their classmates have brown eyes, how many cups of coffee their teacher drinks - there are so many things they can track using the universal tally method. It's a useful skill and a great way to get them learning about the scientific method.
We have three columns one for the item, tally and total allowing for quick and easy reading of collected data which can be transformed into a bar chart, pie chart or diagram.
Once you're ready to download this tally chart template simply click the green download now button, save, print, and enjoy, It really is as simple as that.
You can support your child's learning and knowledge of data collection methods by conducting mini-experiments in your own home with this tally chart template!
Learning and teaching at home can be a challenge. But, at Twinkl, we want to make that challenge into something manageable and fun for both you and your kids!
Introduce data collection methods at home with this blank template. It's fully customisable, giving you all the control to teach your way.
Using this tally chart template is a brilliant way to take all that data collected and store it in one easy to read sheet. It's also great to show children the importance of data collecting and how tallying works.
Need some more tally themed resources? Look no further...
Twinkl Top Tip ~ If you're looking for some ideas on how to use this tally chart template at home, why don't you try some of the following suggestions? You can ask your children to tally the number of times a word is said in their favourite TV show or how many cars of each colour they see on a long road trip or that passes by your house.
What is a tally chart? A tally chart is a way of organising and compiling data using a table and score marks to denote quantity. A tally chart are a good visual respresentation of data as they are universally used.
Each occurrence of whatever you're measuring is marked with a line, or tally. The fifth tally is drawn diagonally across the other four marks to make a group of five. This makes tally charts especially useful for helping children with their five times tables.
Once you've collected all of the data you need using a tally chart, you can then use your data to create a more detailed graph or chart.
 Home
Home  Membership
  Customer Support
  Create
  Blog
Blog