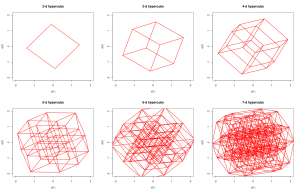
On the train home from Manchester the other day (no wifi!), I was thinking about exploring high-dimensional constrained parameter spaces (possibly sad, but something that statisticians do!), and it occurred to me that I didn’t have very good intuition about the structure of hypercubes in dimensions d>4. Since I was sat with my netbook in front of me listening to music and too tired from 2 days of meetings to do any real work, I decided to write a bit of code to build, rotate and plot 2-D projections of d-D hypercubes for arbitrary integer d>1. In principle there are many languages I could have done this in, but I knew it would be very quick and easy using R.
R is the de-facto standard language for statistical computing, data analysis and plotting, and is rapidly becoming the standard language for statistical bioinformatics and systems biology. It is free, interactive, and has a mind-boggling array of packages implementing a huge variety of statistical methods, including most state-of-the-art techniques. Further, via the BioConductoR project, it now has an impressive range of packages specifically targeting bioinformatics applications. The language itself is relatively simple and easy-to-learn, and is well-suited to programming with data. That said, it is not the most elegant of programming languages, and (rather confusingly) it has two somewhat incompatible object models, but that is perhaps a topic for another day. There are many available introductions to R, so I’m not going to repeat that here, though I do have an introductory tutorial on an old web page that is still worth a look.
So I wrote the code (it’s only around 50 lines, and took around 30 minutes to write and debug), and running it produces plots like these:

I’ve appended the code below, as it illustrates a lot of basic R programming concepts. Essentially, the idea is to use vectors and matrices as much as possible, but not to be really obsessed about avoiding for loops if performance isn’t critical. The code isn’t commented, but it’s highly structured and easy to understand. The function makevertices creates a matrix whose columns are the vertex locations of a hypercube. The function makeedges creates a matrix whose columns give pairs of vertex indices representing the edges of the hypercube (pairs of vertices a distance of 1 apart). The function rotate picks a pair of coordinate axes at random and rotates the hypercube in that plane. The rest are obvious, and the file finishes with some example ways to call the code. As well as illustrating the basic programming concepts such as functions, vectors, matrices and matrix operations and looping, the code also illustrates several other useful concepts such as integer division and modular arithmetic, conditional execution, optional arguments, dynamically growing a matrix, randomly sampling without replacement, plotting lines, plot options, anonymous function arguments, etc.
# hypercube.R
# code to rotate arbitrary d-dimensional hypercubes

# function definitions
makevertices=function(d)
{
	numv=2^d
	vertices=matrix(0,nrow=d,ncol=numv)
	for (j in 1:numv) {
		count=j-1
		for (i in 1:d) {
			vertices[i,j]=count%%2
			count=count%/%2
		}
	}
	vertices
}

makeedges=function(vertices)
{
	d=dim(vertices)[1]
	numv=dim(vertices)[2]
	edges=NULL
	for (j in 1:numv) {
		for (i in j:numv) {
			if (sum(abs((vertices[,i]-vertices[,j])))==1) {
				edges=cbind(edges,c(i,j))
			}
		}
	}
	edges
}

rotate=function(vertices,angle=0.2)
{
	d=dim(vertices)[1]
	axes=sort(sample(1:d,2))
	rotmat=diag(rep(1,d))
	rotmat[axes[1],axes[1]]=cos(angle)
	rotmat[axes[2],axes[1]]=sin(angle)
	rotmat[axes[1],axes[2]]=-sin(angle)
	rotmat[axes[2],axes[2]]=cos(angle)
	vertices=rotmat %*% vertices
	vertices
}

plotcube=function(vertices,edges,col=2,lwd=2)
{
	d=dim(vertices)[1]
	plot(NULL,xlim=c(-2,2),ylim=c(-2,2),main=paste(d,"-d hypercube",sep=""),xlab="x(1)",ylab="x(2)")
	for (i in 1:dim(edges)[2]) {
		lines(c(vertices[1,edges[1,i]],vertices[1,edges[2,i]]),c(vertices[2,edges[1,i]],vertices[2,edges[2,i]]),col=col,lwd=lwd)
	}
}

rotationplot=function(vertices,edges,rotations=20,...)
{
	for (count in 1:rotations) {
		vertices=rotate(vertices,...)
		plotcube(vertices,edges)
	}
}

hypercube=function(d=4,...)
{
	vertices=makevertices(d)
	edges=makeedges(vertices)
	vertices=2*vertices
	vertices=vertices-1
	rotationplot(vertices,edges,...)
}

# examples

# hypercube()
# hypercube(3)
# hypercube(4,angle=0.1)
# hypercube(5,rotations=30)

# eof
Nice and very useful example for computational statistics class. I’m going to borrow it 🙂